d for Single t from Means
Description
This function displays d and non-central confidence interval for d for single t tests from means.
The formula for d is: $$d = \frac{M - \mu}{SD}$$
The formula for t is: $$t = \frac{M - \mu}{SE}$$
R Function
d.single.t(m, u, sd, n, a = 0.05)
Arguments
- m = sample mean
- u = population mean
- sd = sample standard deviation
- n = sample size
- a = significance level
Example
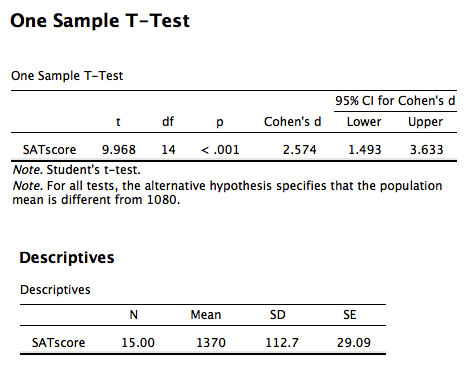
A school has a gifted/honors program that they claim is significantly better than others in the country. The gifted/honors students in this school scored an average of 1370 on the SAT, while the national average for gifted programs is a SAT score of 1080. The data are available on GitHub. Example output from JASP, SPSS, and SAS are shown below.
JASP
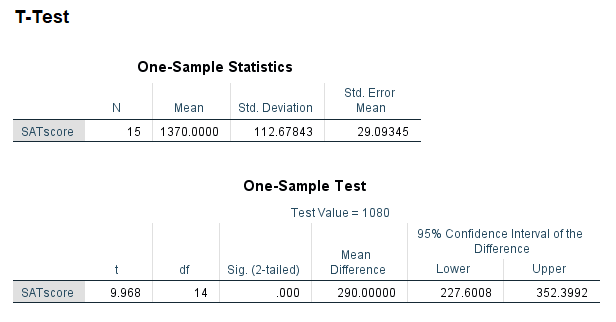
SPSS
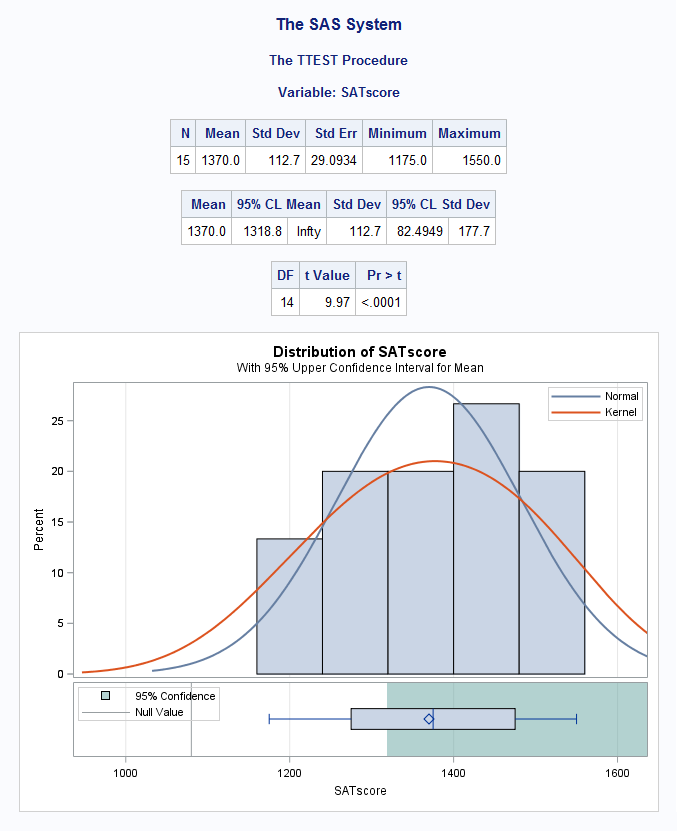
SAS
Function in R:
d.single.t(m = 1370, u = 1080, sd = 112.7, n = 15, a = .05)
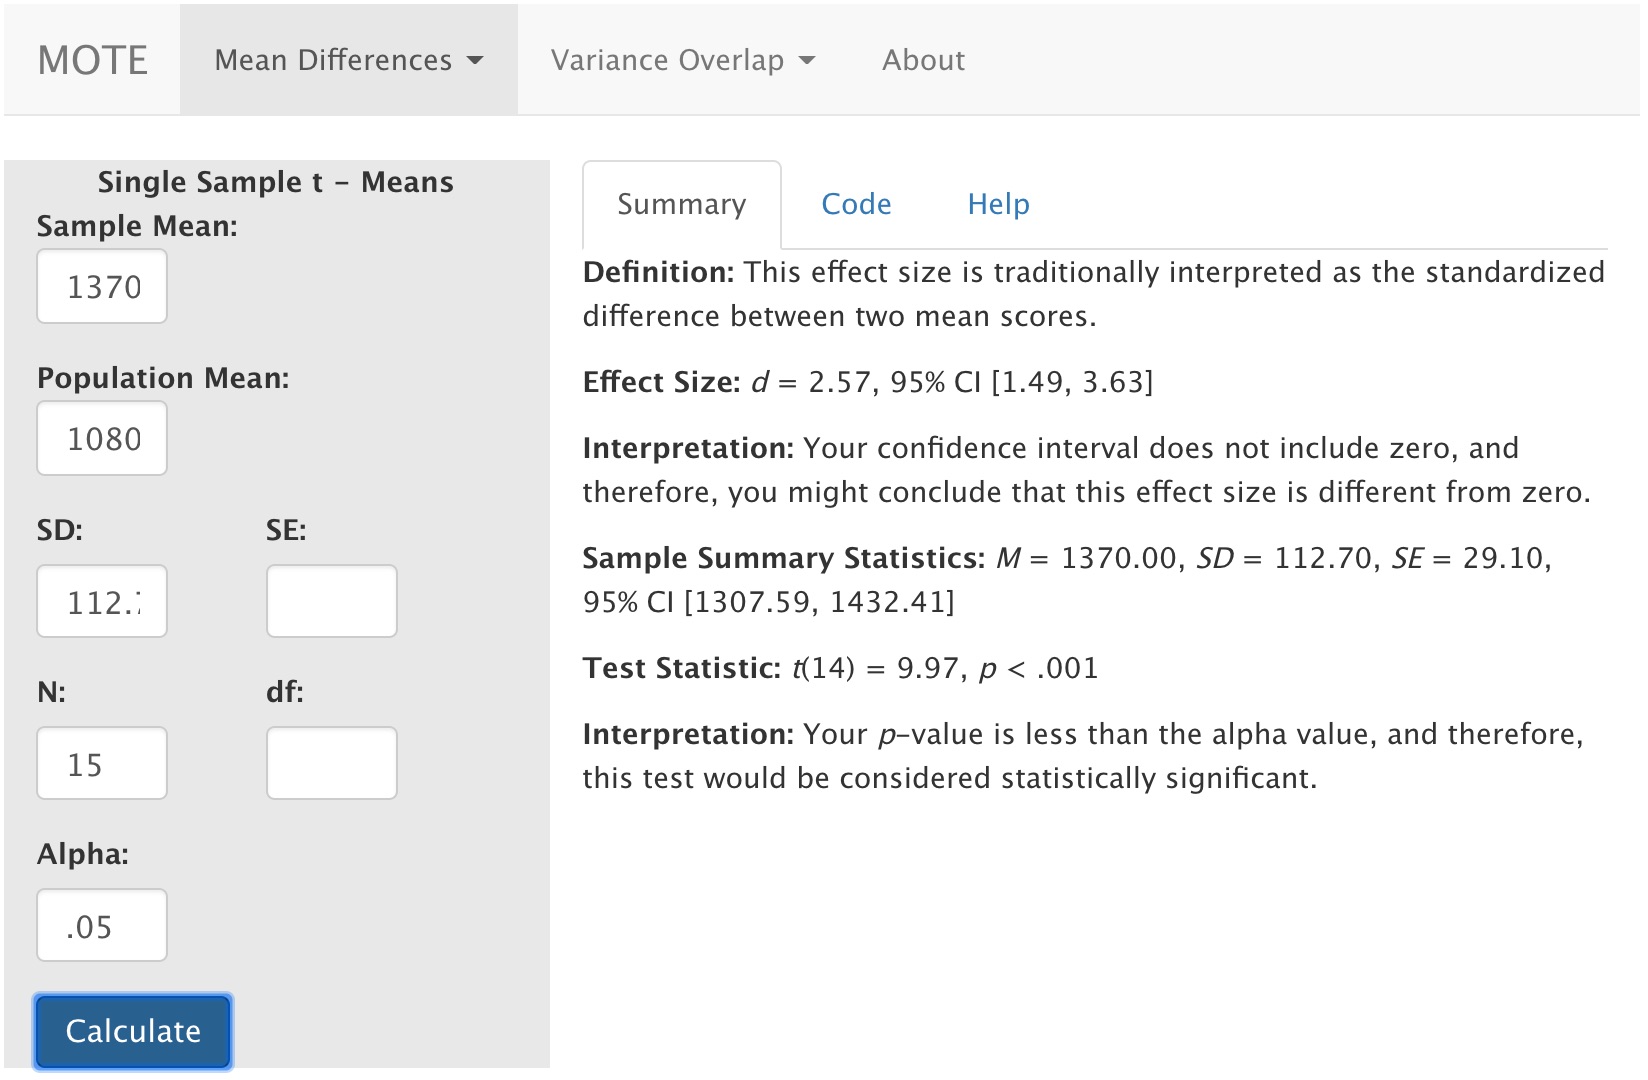
MOTE
Screenshot
Effect Size:
Effect Size: d = 2.57, 95% CI [1.49, 3.63]
Interpretation:
Your confidence interval does not include zero, and therefore, you might conclude that this effect size is different from zero.
Summary Statistics:
M = 1370.00, *S*D = 112.70, *S*E = 29.10, 95% CI [1307.59, 1432.41]
Test Statistic:
t(14) = 9.97, p < .001
Interpretation:
Your p-value is less than the alpha value, and therefore, this test would be considered statistically significant.
