r to Coefficient of Determination (R2) from F
Description
This function displays transformation from r to r2 to calculate the non-central confidence interval for $r^{2}$ using the F distribution.
The formula for t is: $$\frac{r}{\sqrt{ \frac{1-r^2} {(N - 2)}}}$$
R Function
r.correl(r, n, a)
Arguments
- r = correlation coefficient
- n = sample size
- a = significance level
Example
What is the correlation between miles per gallon and car weight? Are lighter cars more fuel-efficient?
This example is derived from the mtcars dataset, provided in R. An amended dataset is available on our GitHub. Example output from JASP, SPSS, and SAS are shown below.
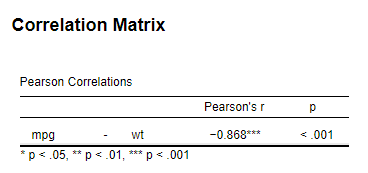
JASP
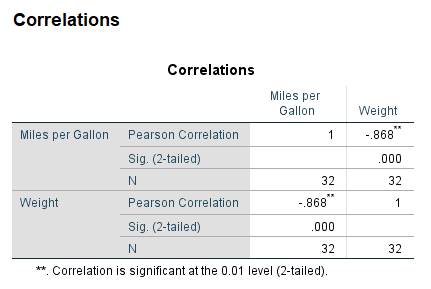
SPSS
SAS
- r = -0.868
- n = 32
- a = .05
Function in R:
r.correl(r = -0.868, n = 32, a = 0.05)
MOTE
Screenshot
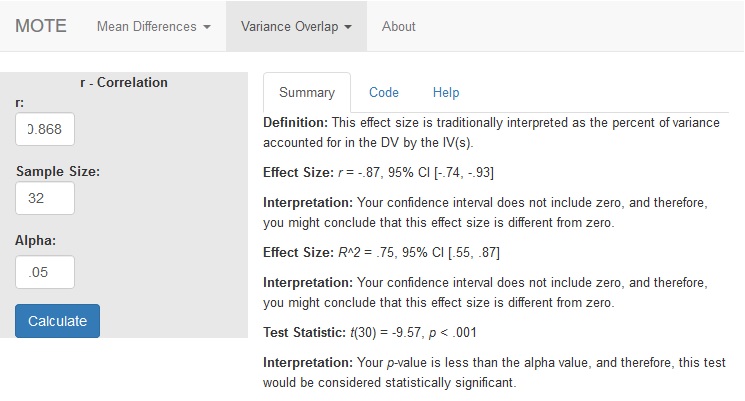
Definition: This effect size is traditionally interpreted as the percent of variance accounted for in the DV by the IV(s).
Effect Size:
r = -.87, 95% CI [-.74, -.93]
Interpretation:
Your confidence interval does not include zero, and therefore, you might conclude that this effect size is different from zero.
Effect Size:
$R^{2}$ = .75, 95% CI [.55, .87]
Interpretation:
Your confidence interval does not include zero, and therefore, you might conclude that this effect size is different from zero.
Test Statistic:
t(30) = -9.57, p < .001
Interpretation:
Your p-value is less than the alpha value, and therefore, this test would be considered statistically significant.
