Eta and Coefficient of Determination (R2) for ANOVA from F
Description
The formula for $\eta^{2}$ is: $${df_{model} \times F_{model}\over df_{model} \times F_{model} + df_{error}}$$
This value will be $\eta^{2}$ when you use a one-way ANOVA and will be $\eta_{p}^{2}$ when you use a multi-way ANOVA (more than one IV).
R Function
eta.F(dfm, dfe, Fvalue, a = .05)
Arguments
- dfm = degrees of freedom for the model/IV/between
- dfe = degrees of freedom for the error/residual/within
- Fvalue = F statistic
- a = significance level
Example
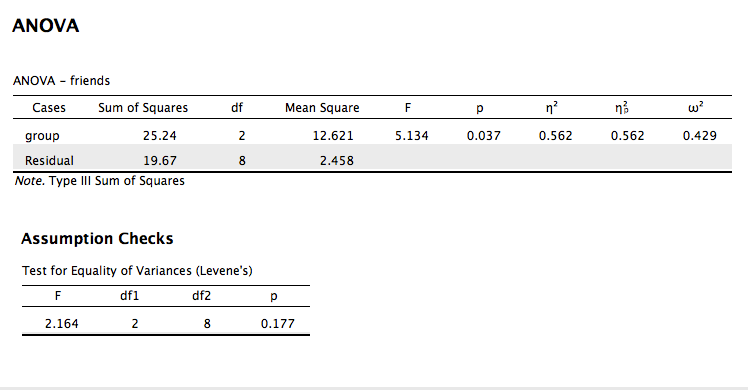
A health psychologist recorded the number of close inter-personal attachments of 45-year-olds who were in excellent, fair, or poor health. People in the Excellent Health group had 4, 3, 2, and 3 close attachments; people in the Fair Health group had 3, 5, and 8 close attachments; and people in the Poor Health group had 3, 1, 0, and 2 close attachments. The data are available on GitHub. Example output from JASP, SPSS, and SAS are shown below.
JASP
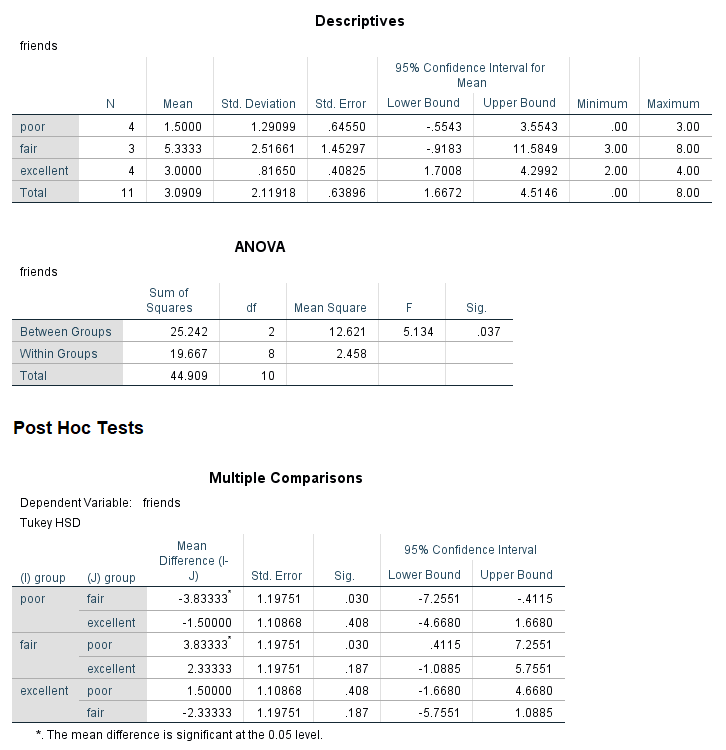
SPSS
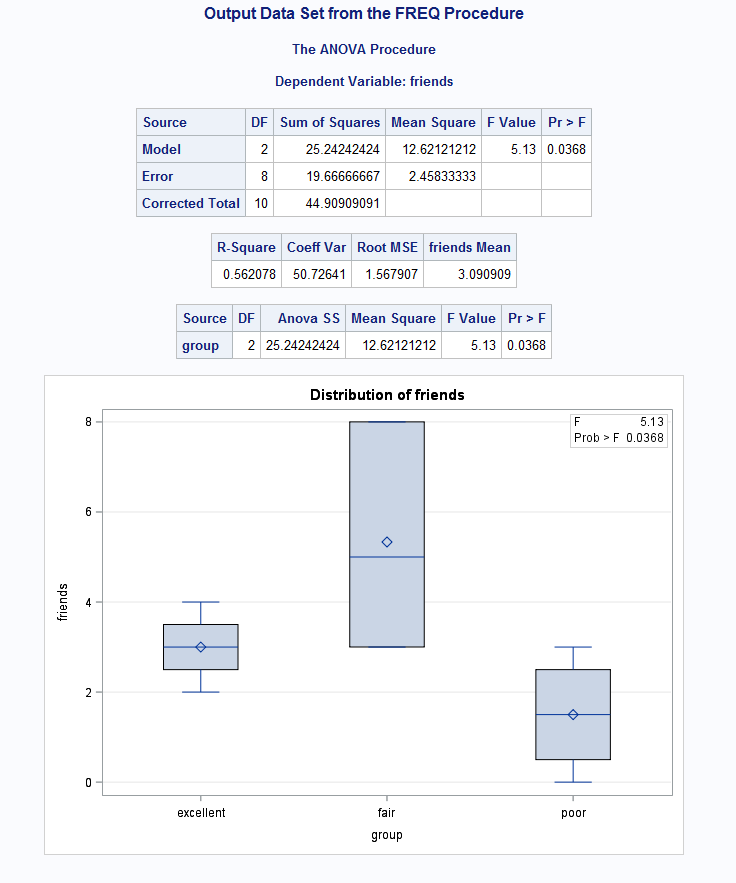
SAS
Function in R:
eta.F(dfm = 2, dfe = 8, Fvalue = 5.134, a = 0.05)
MOTE
Screenshot
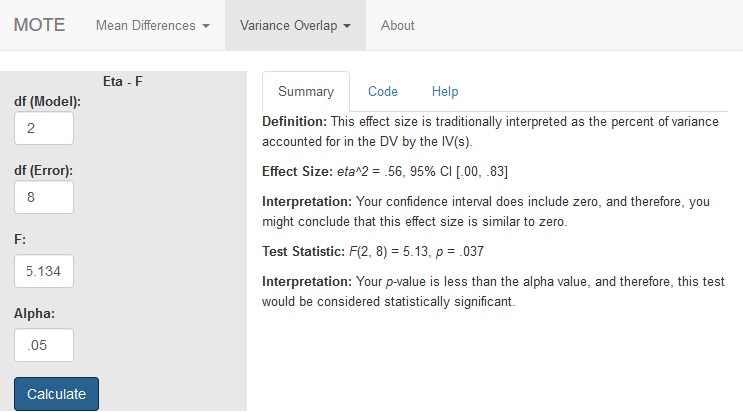
Effect Size:
$\eta^2$ = .56, 95% CI [.00, .83]
Interpretation:
Your confidence interval does include zero, and therefore, you might conclude that this effect size is similar to zero.
Summary Statistics:
Not applicable.
Test Statistic:
F(2, 8) = 5.13, p = .037
Interpretation:
Your p-value is less than the alpha value, and therefore, this test would be considered statistically significant.
