d-g Corrected for Independent t
Description
This function displays $d_{g}$ corrected and the non-central confidence interval for independent t.
The formula for $d_{g}$ is: $$d_{g} = \frac{M_{1} - M_{2}}{SD_{pooled}}\times(1-\frac{3}{4 \ times (N_1+N_2)-9})$$
The formula for t is: $$t = \frac{M_{1} - M_{2}}{SE_{pooled}}$$
R Function
g.ind.t(m1, m2, sd1, sd2, n1, n2, a = 0.05)
Arguments
- m1 = mean one
- m2 = mean two
- sd1 = standard deviation group one
- sd2 = standard deviation group two
- n1 = sample size group one
- n2 = sample size group two
- a = significance level
Example
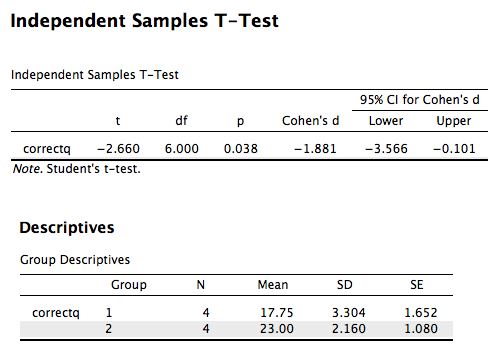
A forensic psychologist conducted a study to examine whether being hypnotized during recall affects how well a witness can remember facts about an event. Eight participants watched a short film of a mock robbery, after which each participant was questioned about what he or she had seen. The four participants in the experimental group were questioned while they were hypnotized and gave 14, 22, 18, and 17 accurate responses. The four participants in the control group gave 20, 25, 24, and 23 accurate responses. The data are available on GitHub. Example output from JASP, SPSS, and SAS are shown below.
JASP
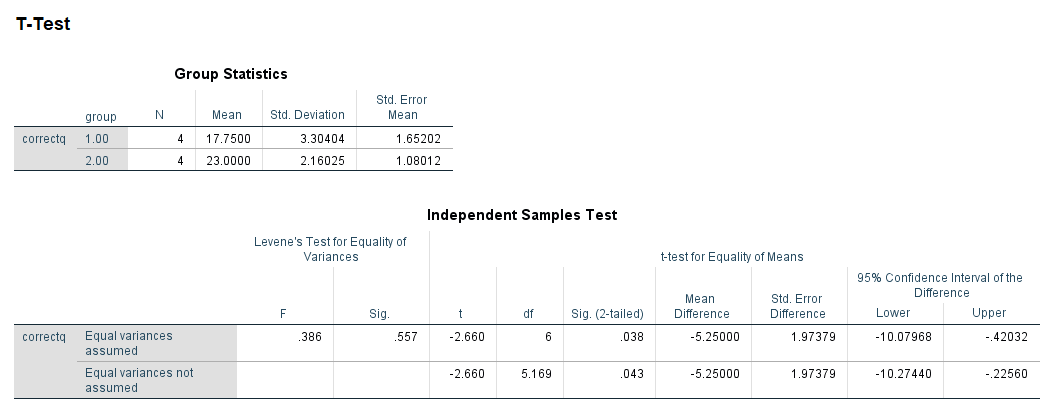
SPSS
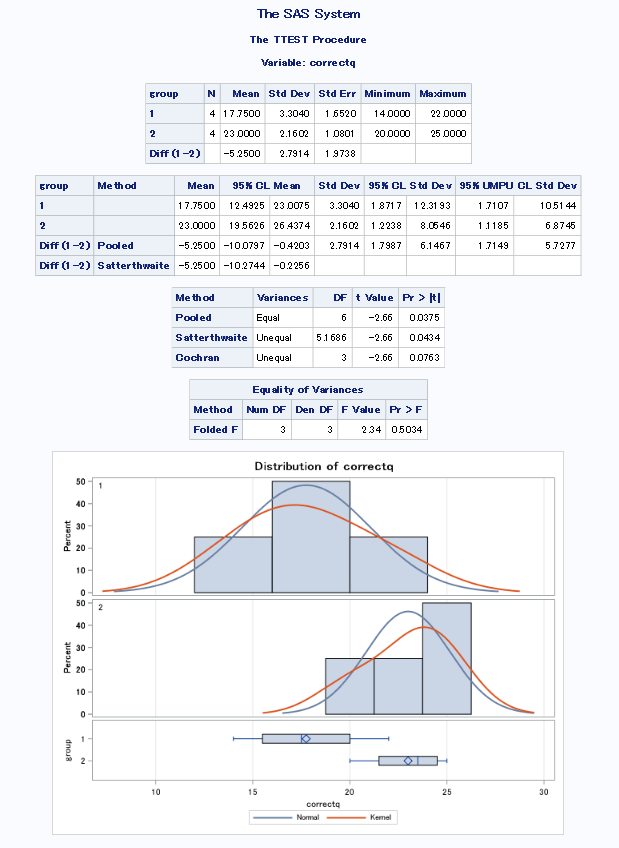
SAS
Function in R:
g.ind.t(m1 = 17.75, m2 = 23, sd1 = 3.304, sd2 = 3.304, n1 = 4, n2 = 4, a = 0.05)
MOTE
Screenshot
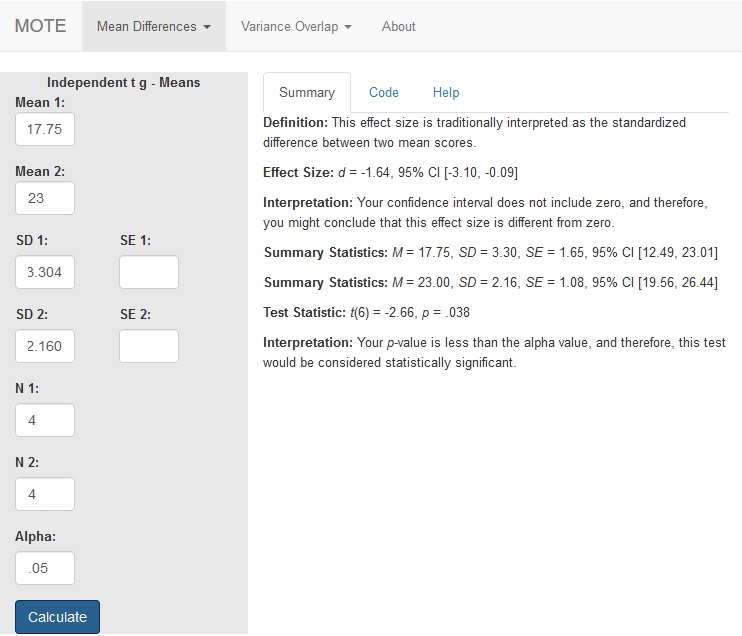
Effect Size:
$d_{g}$ = -1.64, 95% CI [-3.10, -0.09]
Interpretation:
Your confidence interval does not include zero, and therefore, you might conclude that this effect size is different from zero.
Summary Statistics:
M = 17.75, SD = 3.30, SE = 1.65, 95% CI [12.49, 23.01]
M = 23.00, SD = 2.16, SE = 1.08, 95% CI [19.56, 26.44]
Test Statistic:
t(6) = -2.66, p = .038
Interpretation:
Your p-value is less than the alpha value, and therefore, this test would be considered statistically significant.
