Omega Squared for ANOVA from F
Description
This function displays omega squared from ANOVA analyses and its non-central confidence interval based on the F distribution. These values are calculated directly from F statistics and can be used for between subjects and repeated measures designs. Remember if you have two or more IVs, these values are partial omega squared.
The formula for $\omega^2$ is: $$\frac{df_{model} \times (F_{model} - 1)}{df_{model} \times (F_{model} - 1) + N}$$
This value will be $\omega^2$ for one-way ANOVA designs and will be $\omega_p^2$ for multi-way ANOVA designs (i.e. with more than one IV).
R Function
omega.F(dfm, dfe, Fvalue, n, a = .05)
Arguments
- dfm = degrees of freedom for the model/IV/between
- dfe = degrees of freedom for the error/residual/within
- Fvalue = F statistic
- n = full sample size
- a = significance level
Example
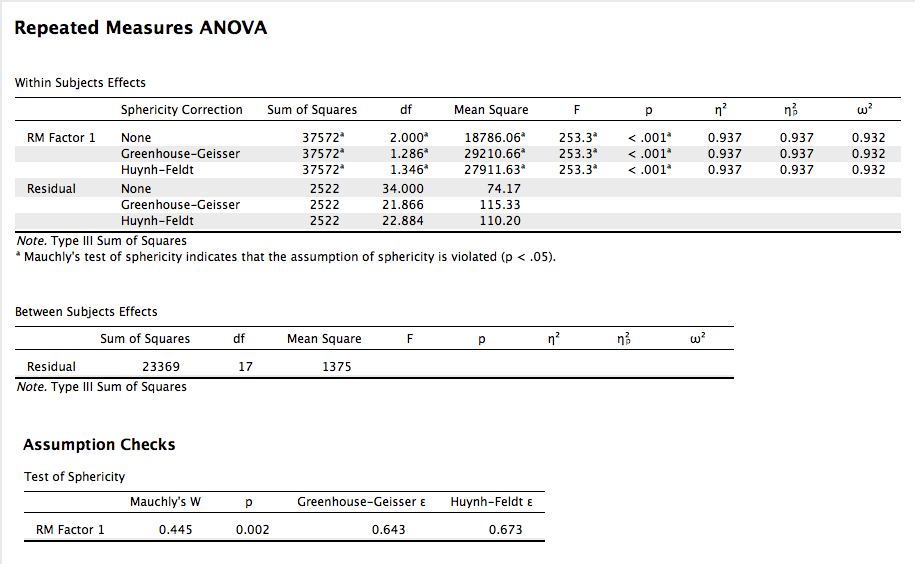
Participants were tested over several days to measure variations in their pulse given different types of stimuli. One stimulus was a neutral picture (like a toaster), while other stimuli were cute/happy pictures (puppies, babies), and negative stimuli (mutilated faces, pictures of war). Were there differences in pulse for each participant across the stimuli? The data are available on GitHub. Example output from JASP, SPSS, and SAS are shown below.
JASP
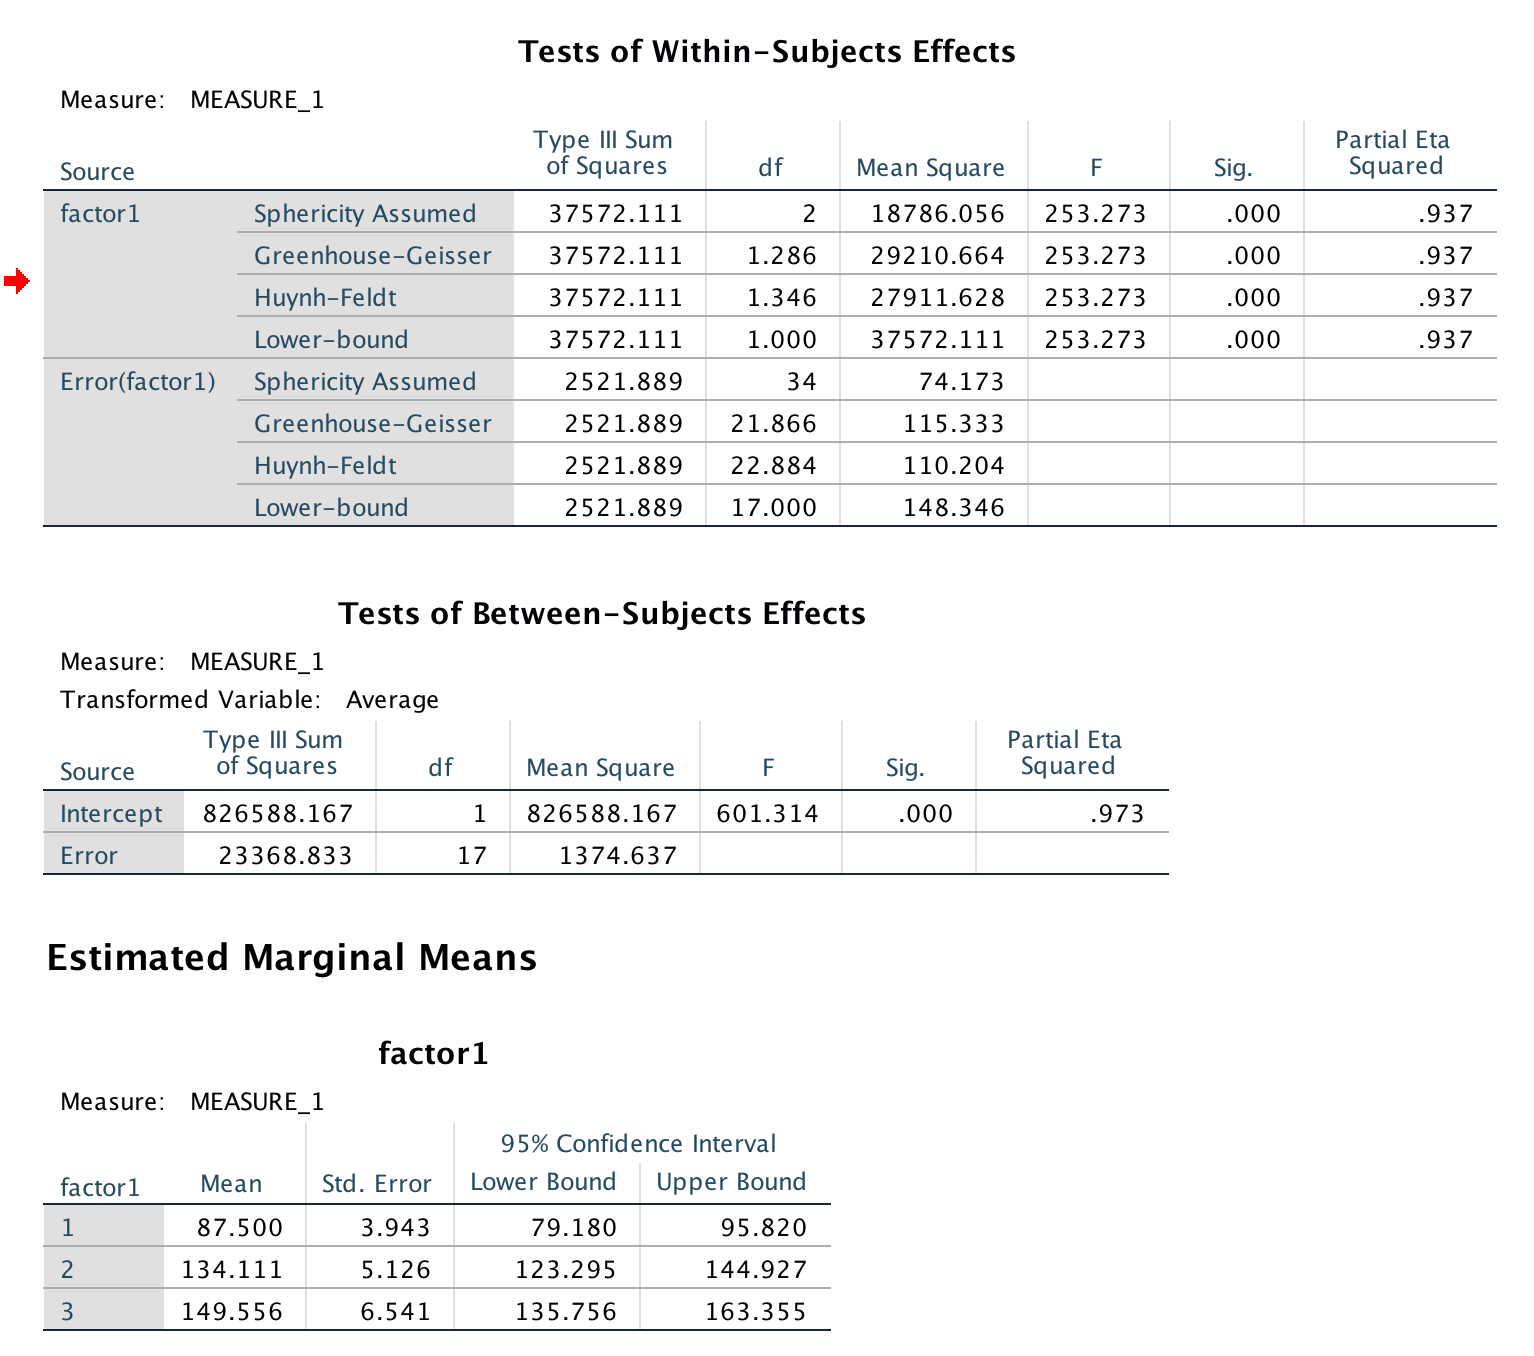
SPSS
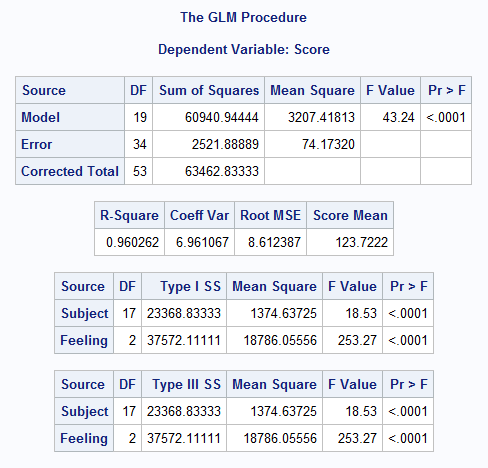
SAS
Function in R:
omega.F(dfm = 2, dfe = 34, Fvalue = 253.273, n = 40, a = .05)
MOTE
Screenshot
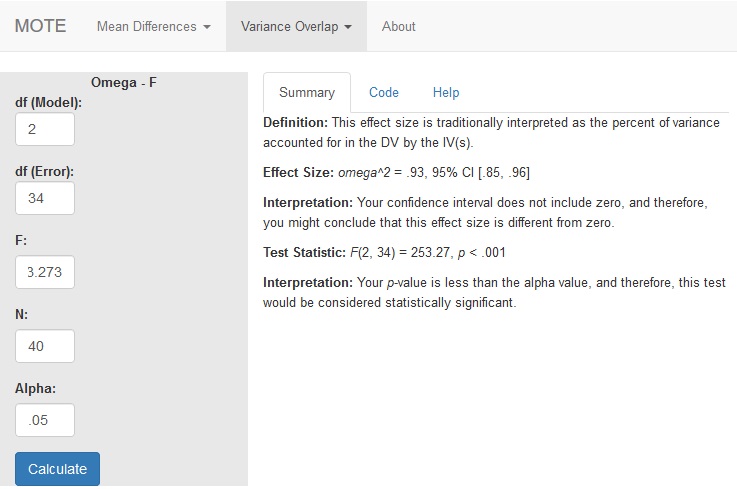
Effect Size:
$\omega^2$ = .93, 95% CI [.85, .96]
Interpretation:
Your confidence interval does not include zero, and therefore, you might conclude that this effect size is different from zero.
Summary Statistics:
Not applicable.
Test Statistic:
F(2, 34) = 253.27, p < .001
Interpretation:
Your p-value is less than the alpha value, and therefore, this test would be considered statistically significant.
