Dependent t Repeated Measures
Description
This function displays $d_{rm}$ for repeated measures data controlling for r and the non-central confidence interval using the average standard deviation of each level as the denominator.
The formula for $d_{rm}$ is: $$d_{rm} = \frac{M_1 - M_2}{\sqrt{(SD_1^2 + SD_2^2) - (2 \times r \times SD_1 \times SD_2)}} \times \sqrt{2 \times (1-r)}$$
R Function
d.dep.t.rm(m1, m2, sd1, sd2, r, n, a = 0.05)
Arguments
- m1 = mean from first level
- m2 = mean from second level
- sd1 = standard deviation from first level
- sd2 = standard deviation from second level
- r = correlation between first and second level
- n = sample size
- a = significance level
Example
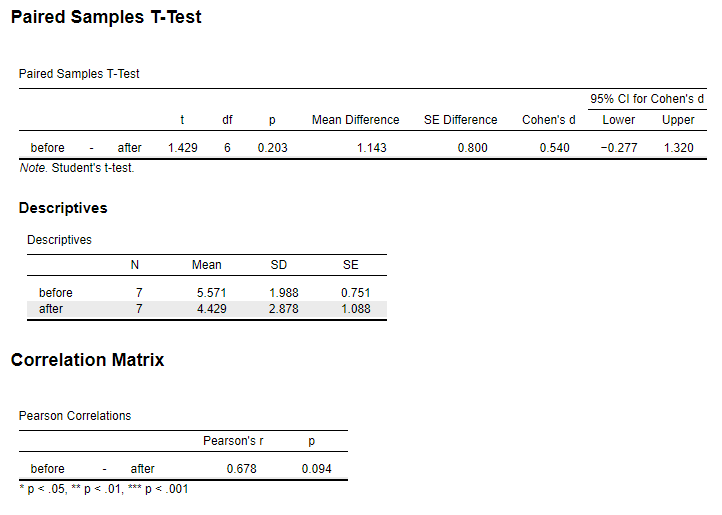
In a study to test the effects of science fiction movies on people’s belief in the supernatural, seven people completed a measure of belief in the supernatural before and after watching a popular science fiction movie. Participants’ scores are shown with high scores indicating high levels of belief. The data are available on GitHub. Example output from JASP, SPSS, and SAS are shown below.
JASP
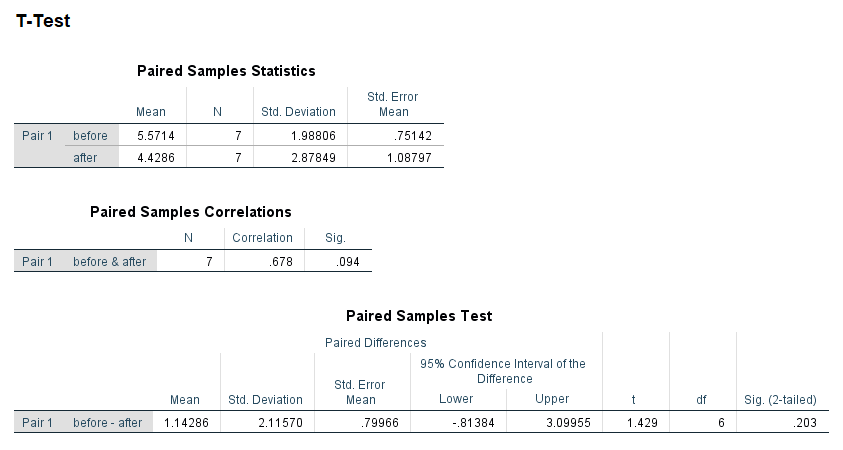
SPSS
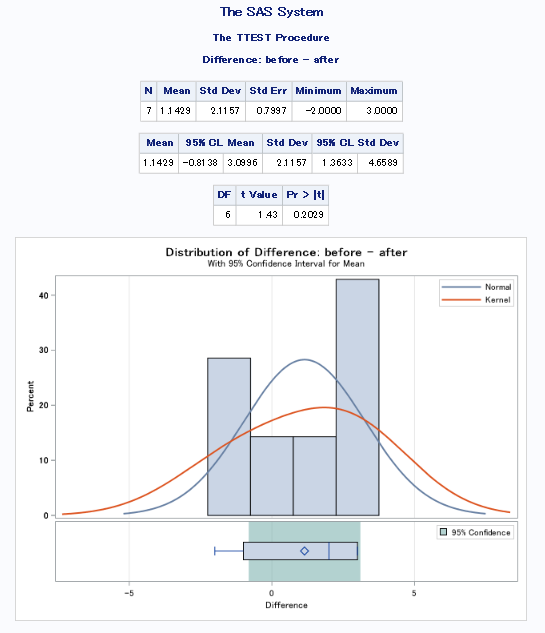
SAS
Function in R:
d.dep.t.rm(m1 = 5.571, m2 = 4.429, sd1 = 1.988, sd2 = 2.878, r = .678, n = 7, a = .05)
MOTE
Screenshot
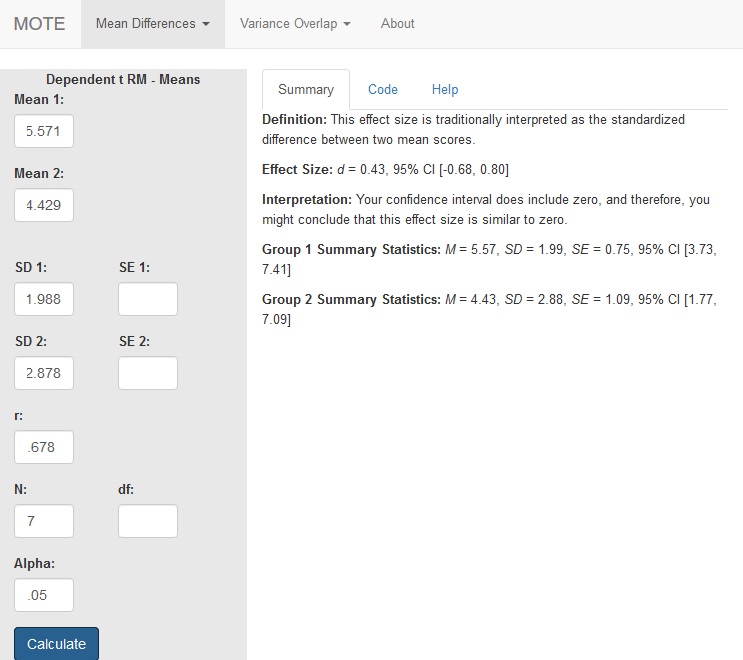
Effect Size:
$d_{rm}$ = 0.43, 95% CI [-0.68, 0.80]
Interpretation:
Your confidence interval does include zero, and therefore, you might conclude that this effect size is similar to zero.
Summary Statistics:
Group 1 Summary Statistics: M = 5.57, SD = 1.99, SE = 0.75, 95% CI [3.73, 7.41]
Group 2 Summary Statistics: M = 4.43, SD = 2.88, SE = 1.09, 95% CI [1.77, 7.09]
Test Statistic:
Not applicable.
Interpretation:
Not applicable.
